FinTrack Financial Dashboard
The Problem
Wealth managers had to manually gather Excel sheets from 5 different sources each morning to compile portfolio summaries, delaying advisory reports to high-net-worth clients.
Our Solution
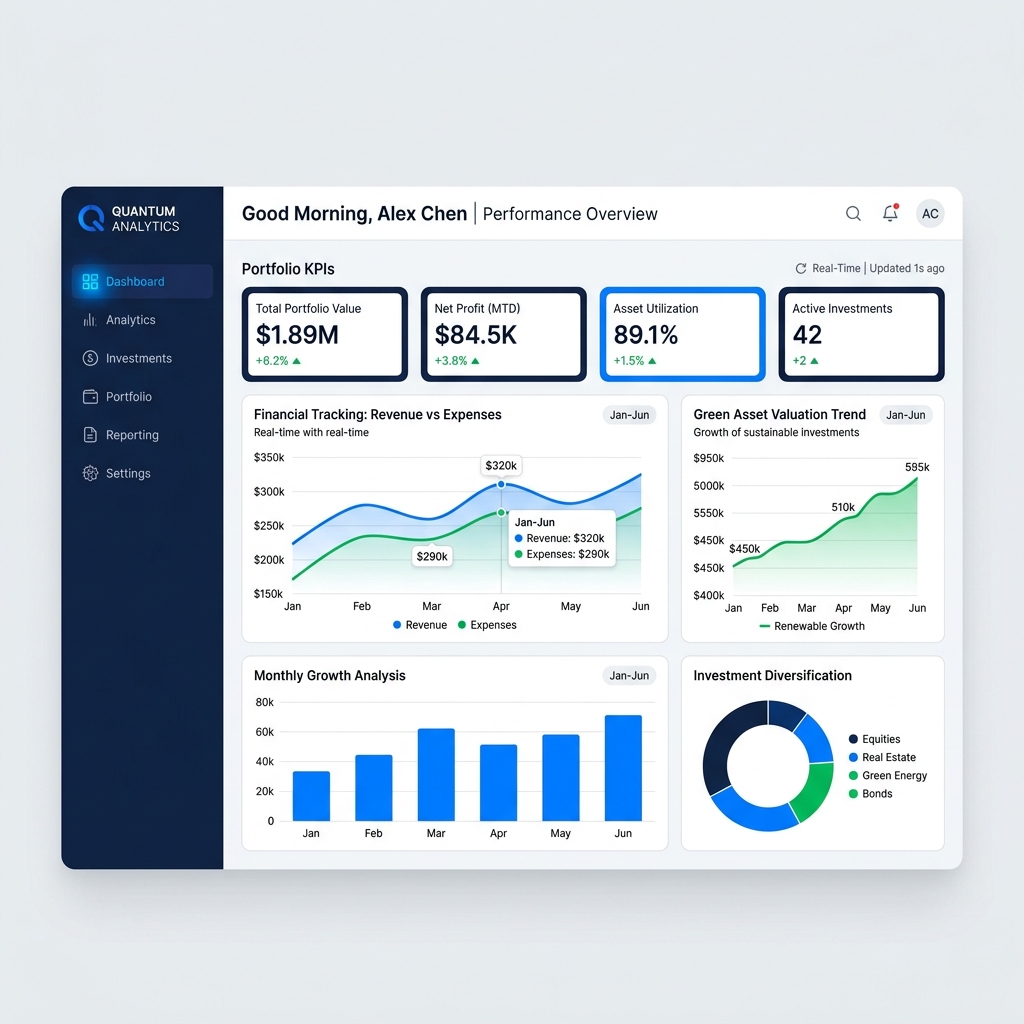
We built a unified dashboard that fetches data directly from financial APIs, aggregates metrics using Python pandas scripts, and visualizes trends using Chart.js inside a responsive React view.
Key Results
Saved wealth managers 2.5 hours of manual work every single day, eliminated reporting errors, and increased advisor productivity by 30%.
Technologies Used:
"The financial dashboard they built has completely automated our morning workflow. Our managers are happier and our clients love the transparent, interactive reports. Highly recommended!"
Vikram Adve
Managing Partner, FinTrack Advisory
Need a similar system built for your business?
Get in touch with our tech architects to review your workflows and get a detailed proposal.
Start a Similar Project