Dashboard & Analytics
Overview
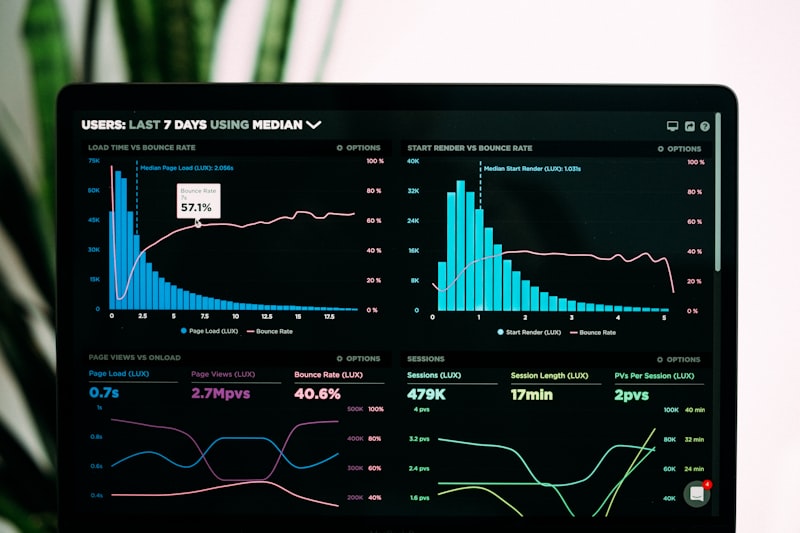
Consolidating isolated database datasets into custom real-time visual control centers built for quick operational auditing.
The Problem: Data is often scattered across isolated tools, making it impossible for executives to gain a clear, unified view of business performance. Manual reporting is slow, prone to errors, and delays decision-making.
Our Solution: We consolidate your isolated data sources into high-performance visual dashboards. Our systems ingestion pipelines process and aggregate millions of rows to display up-to-the-minute metrics with zero latency.
Principles for your digital ecosystem
Data Filters
Drill down to specific regions, cohorts, or periods in seconds.
Live Ingestion
Real-time pipeline ingestion displaying up-to-the-minute operational changes.
Alert Systems
Get SMS or email alerts when critical metrics drift outside normal ranges.
Optimized Rendering
Optimized rendering logic that handles millions of rows without lagging.

DATA ANALYTICS SYSTEM
What's included in our dashboards?
Combining Stripe, PostgreSQL, Salesforce, and third-party APIs into a single dashboard.
Technologies used
Step-by-Step Process
Data Audit
Identifying key metrics and mapping where they live across your systems.
Pipeline Build
Constructing ETL pipelines to clean and aggregate your data streams.
Interface Design
Structuring the layout to highlight critical KPIs clearly.
Live Deployment
Launching the unified dashboard and training your team.
Frequently Asked Questions
Yes. We integrate APIs from Shopify, Zoho, Google Sheets, Facebook Ads, and custom SQL databases into a single, unified view.
Yes. We can configure automated polling scripts or build live WebSocket channels that push metric updates onto your screen instantly.
Yes, we build custom export handlers that generate print-friendly PDFs and clean CSV/Excel spreadsheets with a single click.
We enforce role-based access control (RBAC). For example, managers see company-wide metrics while sales agents only see their individual target boards.
Yes, we configure our charts (using Chart.js or Recharts) to scale fluidly down to mobile screens.